
engineering
projects
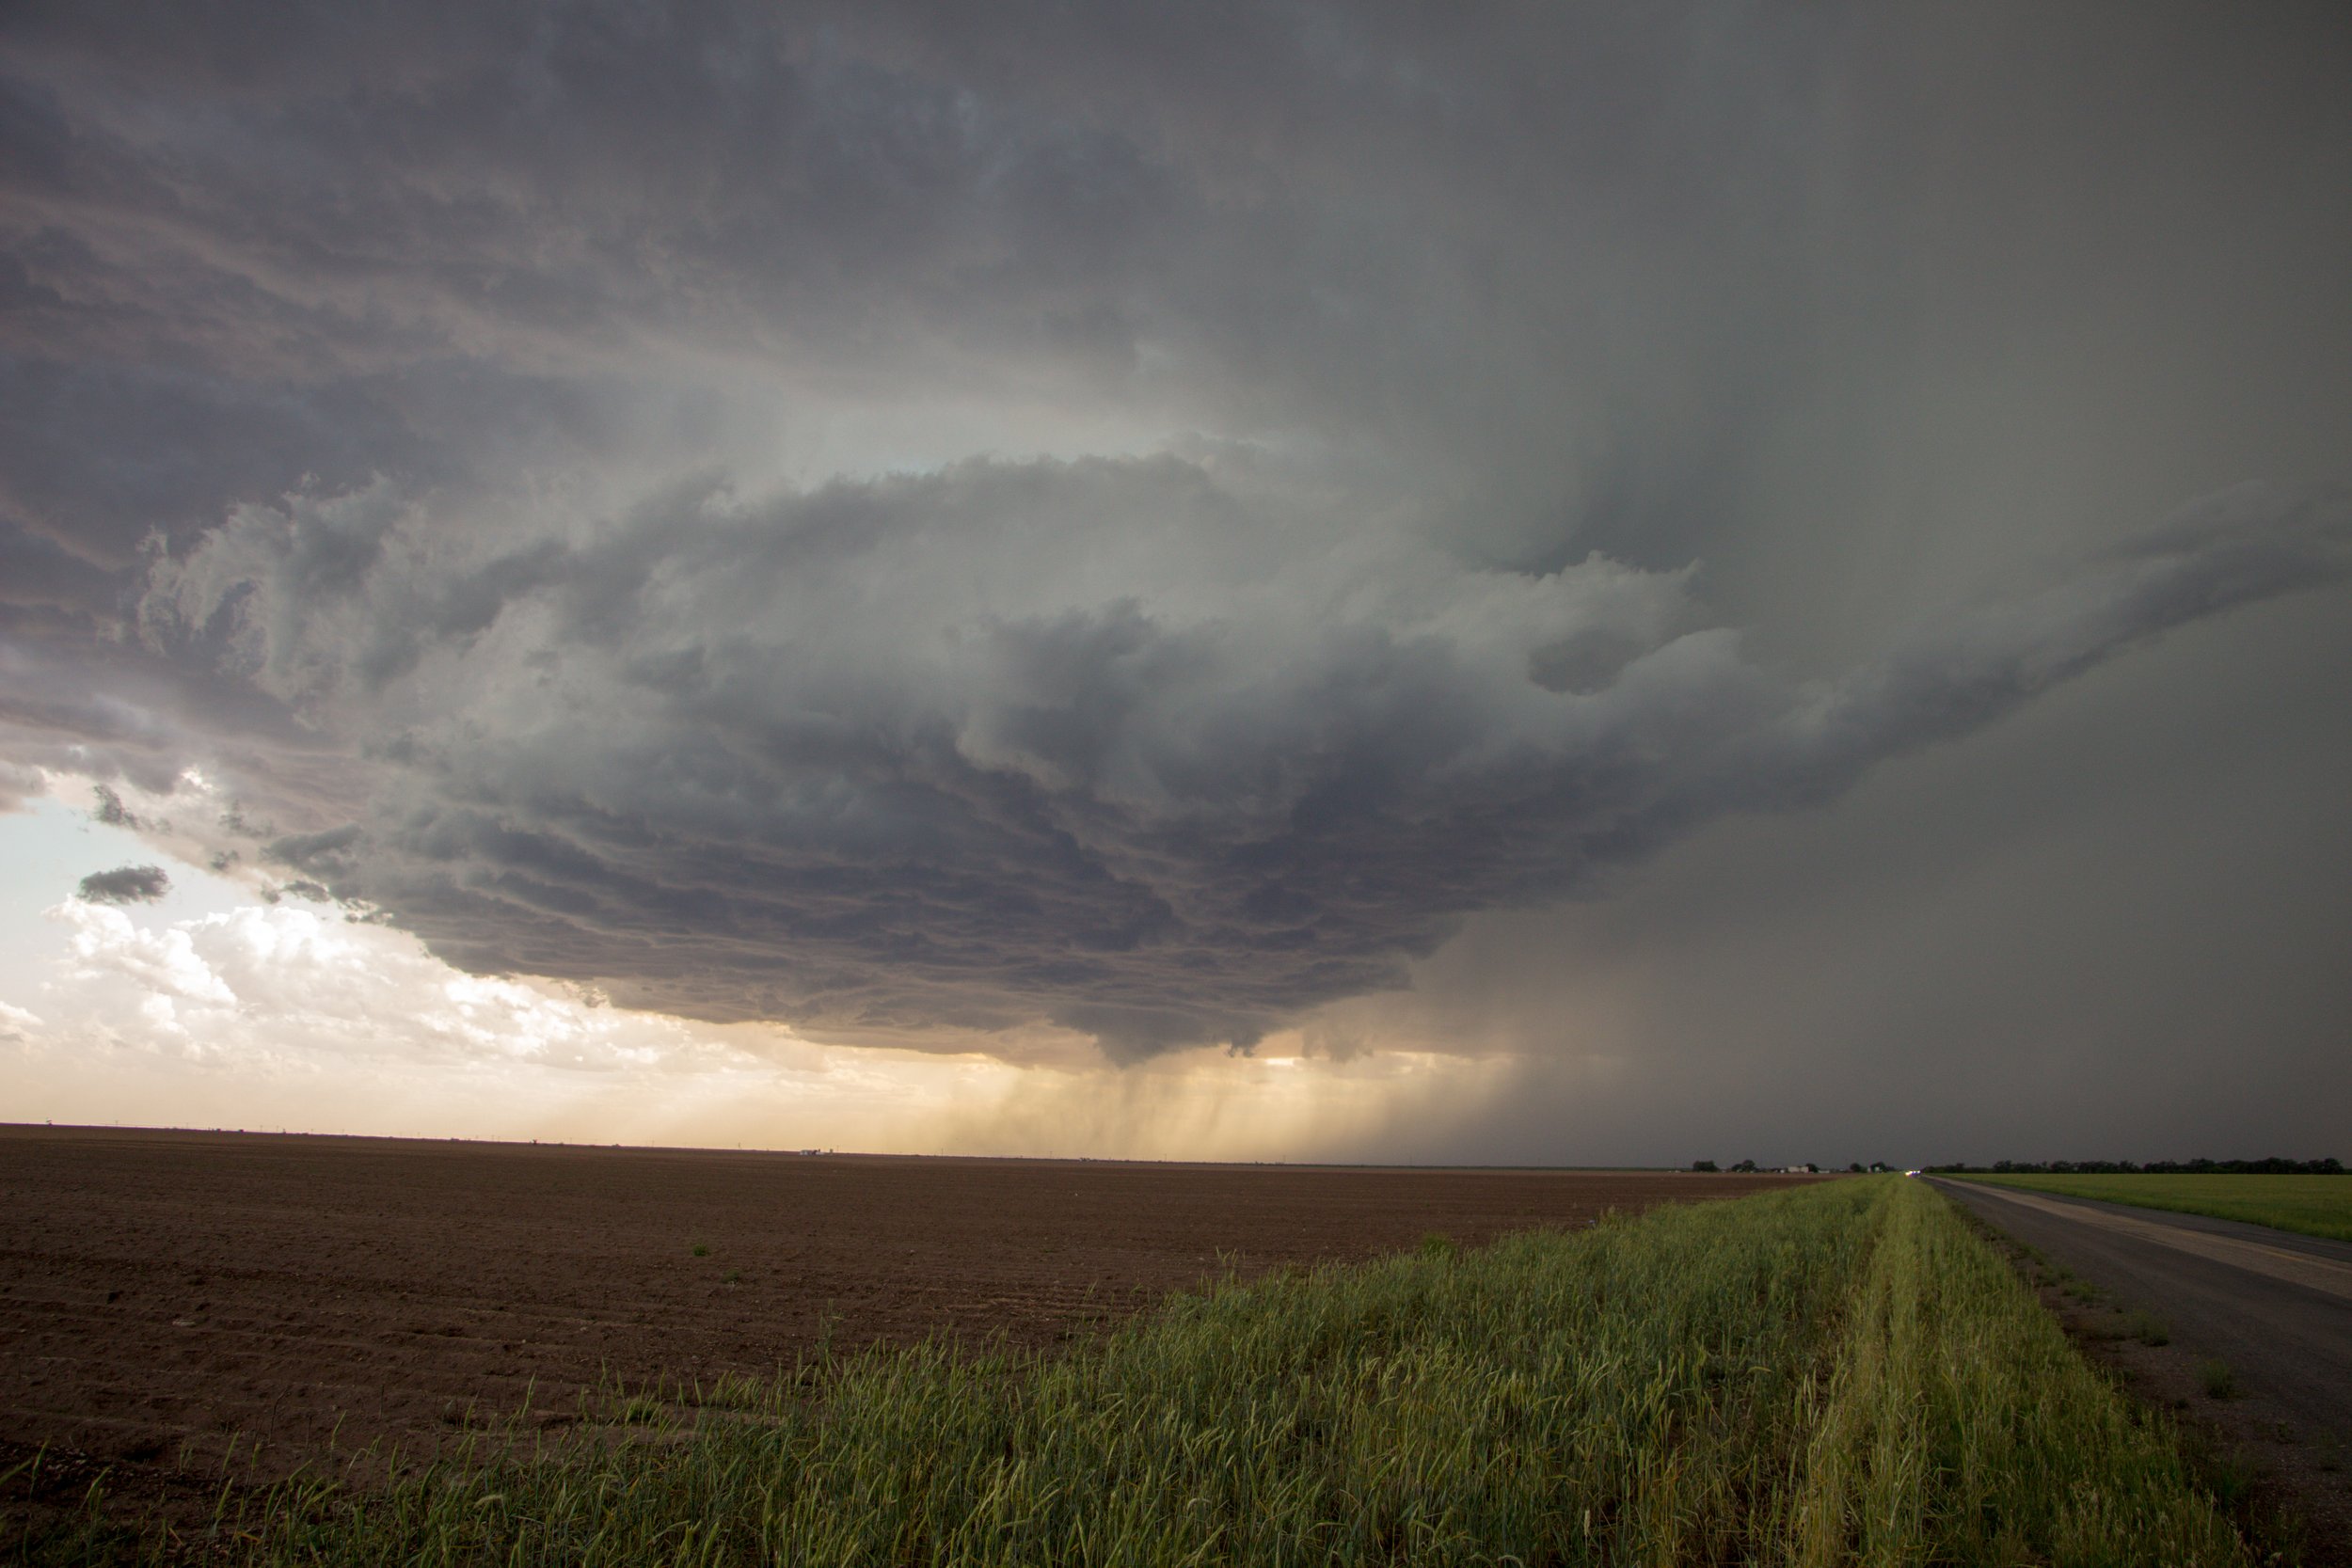
AERIAl supercell measurement system (asms)
Building off of the progress and lessons from the TIMP v1.0, a full proof-of-concept system was designed, built, and tested that would be used to gather locational and atmospheric parameters from supercell thunderstorms. The system consists of three main devices working in conjunction; a Deployment Unmanned Aerial Vehicle (UAV), Sensor Packages, and a Ground Control Station. The Deployment UAV deploys several sensor packages into the inflow/updraft of the supercell thunderstorm, while the Sensor Packages collect the atmospheric and locational data and transmit/store the data. The Ground Control Station is for receiving Sensor Package data and piloting the Deployment UAV. All of this is in an effort to study supercells, which are responsible for intense winds, large hail, and violent tornadoes, while keeping field researchers safe from the storm.

Tornadic inflow measurement probe (timp)
The Tornadic Inflow Measurement Probe (TIMP) is a first proof-of-concept prototype of the that was designed and fabricated over the summer of 2019. This was presented at ASME IMECE 2019 in Salt Lake City, Utah for their undergraduate research design competition. TIMP laid the groundwork for the future development of the sensor packages that are utilized in the Aerial Supercell Measurement System (ASMS).
TIMP v1.0:


Ethan Moriarty at ASME IMECE 2019 in Salt Lake City, Utah, presenting his academic poster of the proof-of-concept TIMP design.
Academic Poster:

The First Generation Prototype:
Datalogging Test 1:
This set of data was collected on July 2nd, 2019, on Mount Carmel in Hamden, CT. The main purpose of this test was to create a 3-D profile of latitude, longitude, and altitude and visualize that path using Google Earth. Note that the 3-D terrain feature in Google Earth is turned off in order to show the elevation difference. Along with the 3-D path visualization, there are graphs of Temperature, Barometric Pressure, and Humidity that are colormapped over the latitude, longitude, and altitude 3-D probe path. This set of plots was generated in MATLAB.


